Setting Up Volume Profile Indicators: A Practical Walkthrough
Master the art of volume profile analysis with this comprehensive guide. Learn how to add, configure, and interpret Volume Profile indicators on TradingView to identify critical support and resistance zones based on trading activity.
What You'll Learn:This guide covers session volume profiles, fixed range profiles, parameter adjustments, and interpretation techniques to help you identify key support and resistance zones using volume data.
Understanding Volume Profile Indicators
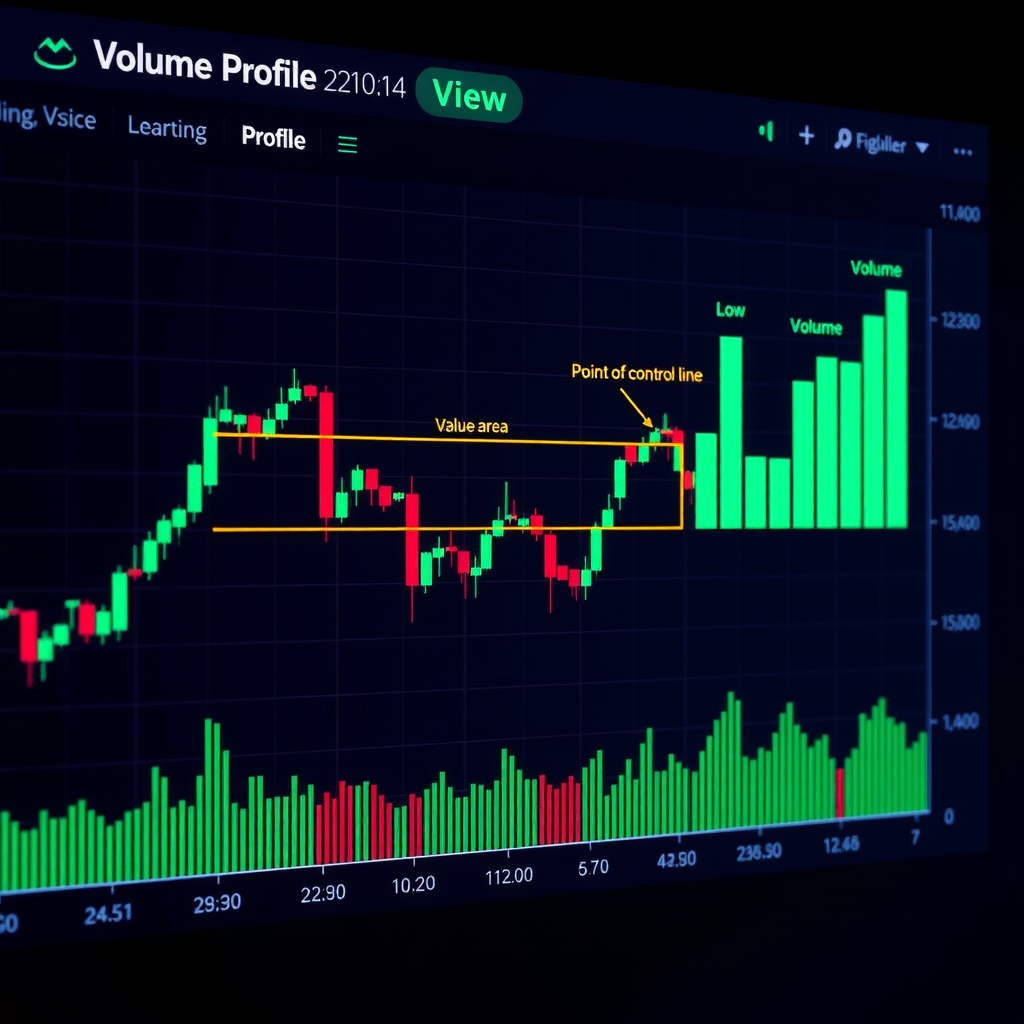
Volume Profile is a powerful charting tool that displays trading activity over a specified time period at specific price levels. Unlike traditional volume indicators that show volume over time, Volume Profile shows volume distributed across price levels, revealing where the most trading activity occurred.
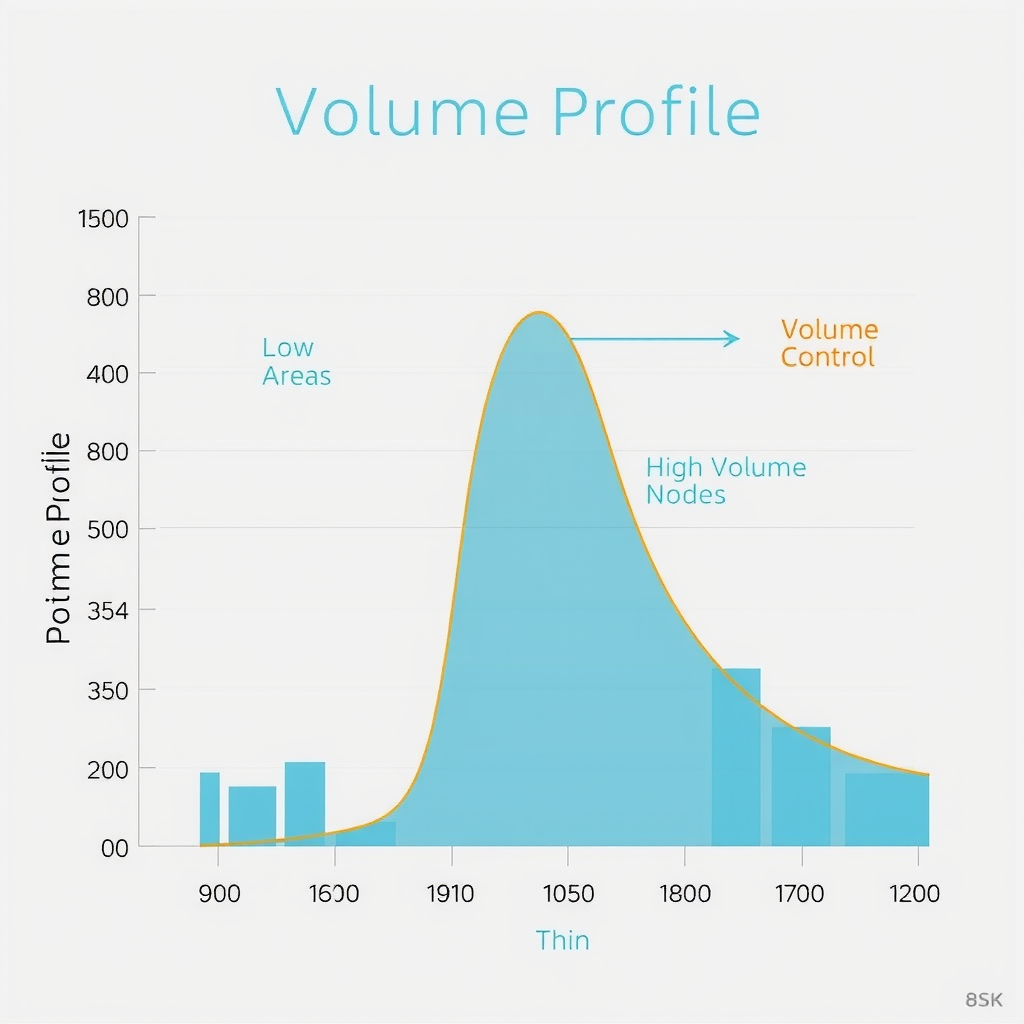
This horizontal histogram helps traders identify:
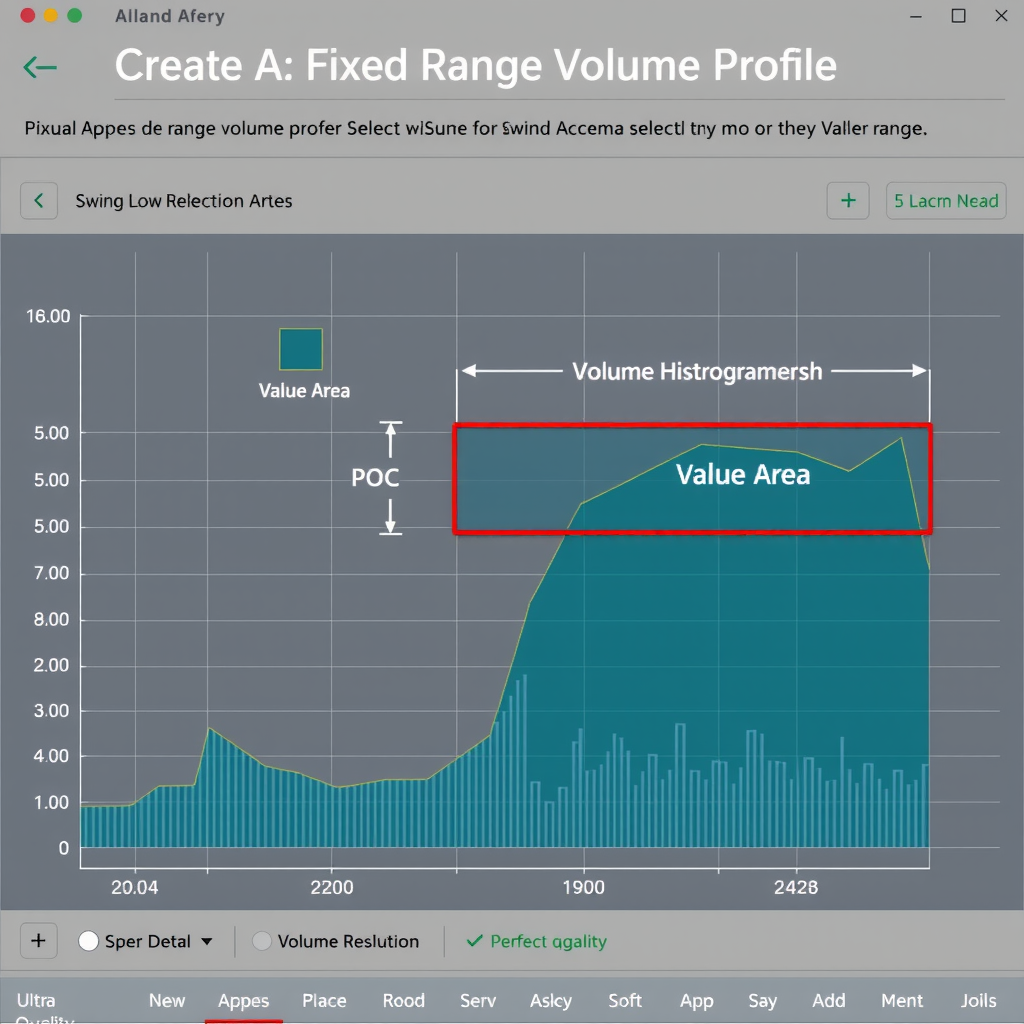
- Point of Control (POC):The price level with the highest traded volume
- Value Area:The range where 70% of the volume occurred
- High Volume Nodes:Price levels with significant trading activity (potential support/resistance)
- Low Volume Nodes:Price levels with minimal activity (areas price may move through quickly)
Adding Volume Profile to Your TradingView Chart
Step 1: Access the Indicators Menu
Open your TradingView chart and locate the indicators button at the top of the chart interface. You can access it by:
- Clicking the "Indicators" button in the top toolbar
- Using the keyboard shortcut:
/ (forward slash) - Clicking anywhere on the chart and typing to open the search
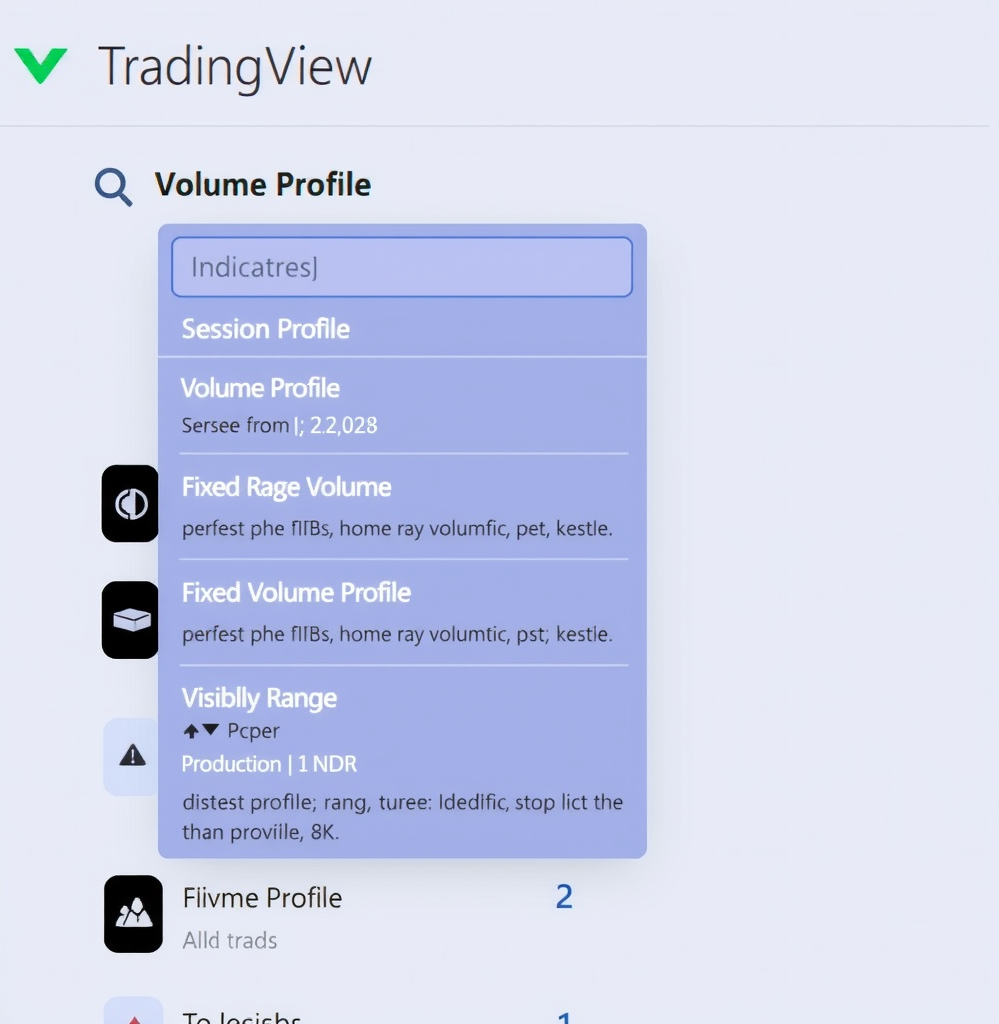
Step 2: Search for Volume Profile
In the indicators search box, type "Volume Profile" to see available options. TradingView offers several built-in Volume Profile indicators:
Available Volume Profile Types:
Session Volume Profile
Automatically displays volume distribution for each trading session (daily, weekly, or monthly). Best for intraday traders who want to see volume patterns within specific time periods.
Fixed Range Volume Profile
Allows you to manually select a specific price range to analyze. Ideal for examining volume distribution during significant market events or specific trading ranges.
Visible Range Volume Profile
Displays volume profile for whatever price range is currently visible on your chart. Updates dynamically as you zoom or scroll.
Step 3: Select Your Preferred Volume Profile Type
For this walkthrough, we'll start with theSession Volume Profileas it's the most commonly used. Click on "Volume Profile" or "Session Volume" from the search results to add it to your chart.
The indicator will immediately appear on your chart, displaying volume histograms on the right side of each trading session.
Configuring Volume Profile Parameters
Once added, you'll want to customize the Volume Profile settings to match your trading style and chart preferences. Click the gear icon next to the indicator name in the indicator list to open the settings panel.
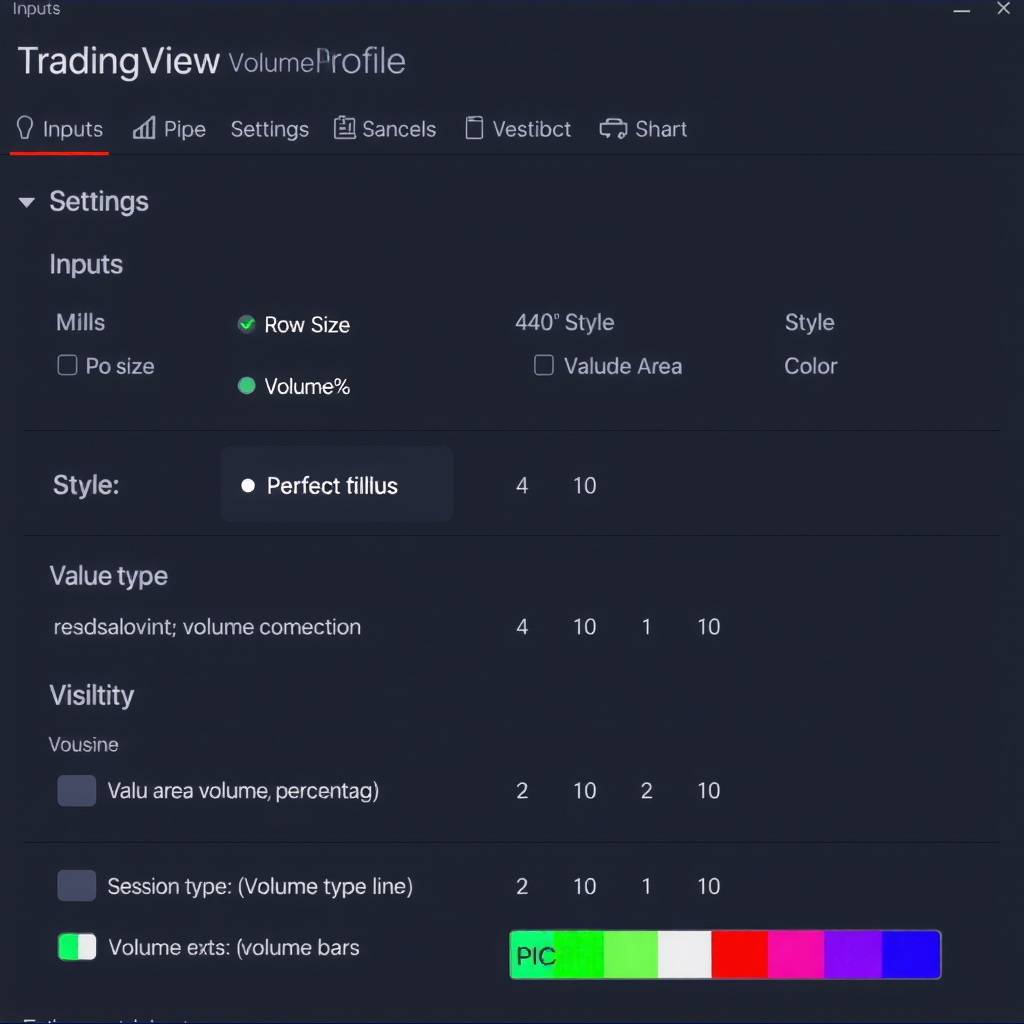
Key Parameters to Configure
Row Size (Number of Rows)
Controls the granularity of the volume histogram. More rows provide finer detail but can make the chart cluttered.
Recommended:24-32 rows for most timeframes. Use fewer rows (12-20) for longer timeframes, more rows (32-48) for intraday analysis.
Value Area Volume
Defines what percentage of volume constitutes the Value Area. The standard is 70%, but you can adjust this based on your analysis needs.
Recommended:Keep at 70% for standard analysis. Some traders use 68% (one standard deviation) or 80% for wider ranges.
Session Type
Choose between Daily, Weekly, Monthly, or Custom session periods. This determines how volume is grouped and displayed.
Recommended:Daily for day trading, Weekly for swing trading, Monthly for position trading.
Placement
Determines where the volume histogram appears on your chart - right side, left side, or overlay on the price action.
Recommended:Right side for cleaner charts, Overlay if you want volume directly on price bars.
Customizing Visual Appearance
In the Style tab, you can customize colors and visibility of different Volume Profile components:
- POC Line Color:Make the Point of Control stand out with a bright, contrasting color
- Value Area Color:Use a semi-transparent color to highlight the value area without obscuring price action
- Volume Histogram Colors:Choose colors that complement your chart theme
- Opacity:Adjust transparency to balance visibility with chart clarity
Pro Tip:Use contrasting colors for the POC line (bright cyan or yellow) and a subtle color for the Value Area (light blue or green with 30-40% opacity) to make key levels immediately visible without cluttering your chart.
Setting Up Fixed Range Volume Profile
Fixed Range Volume Profile is particularly useful for analyzing specific market events, consolidation periods, or significant price ranges. Here's how to configure it:
Adding Fixed Range Volume Profile
- Search for "Fixed Range Volume Profile" in the indicators menu
- Click to add it to your chart
- The cursor will change to a crosshair - click and drag to select your desired price range
- Release to create the volume profile for that specific range
- Adjust the range by dragging the top or bottom edges of the profile
Best Practices for Fixed Range Selection
- Select ranges that encompass complete market structures (swing high to swing low)
- Use for analyzing consolidation zones before breakouts
- Apply to significant events like earnings announcements or economic data releases
- Create multiple fixed range profiles to compare different time periods
- Extend the range to include the entire trend for comprehensive analysis
Interpreting Volume Profile Data
Understanding how to read and interpret Volume Profile is crucial for making informed trading decisions. Here are the key interpretation techniques:
Point of Control (POC) Analysis
The POC represents the price level with the highest traded volume. It acts as a magnet for price action and often serves as:
- Support in uptrends:Price tends to bounce from POC levels during pullbacks
- Resistance in downtrends:Price often stalls at POC levels during rallies
- Fair value:The price where most participants agreed to trade
- Retest zones:Price frequently returns to test POC levels after breaking away
Trading Strategy:Look for entries when price approaches the POC from above (in uptrends) or below (in downtrends), especially if accompanied by bullish/bearish confirmation signals.
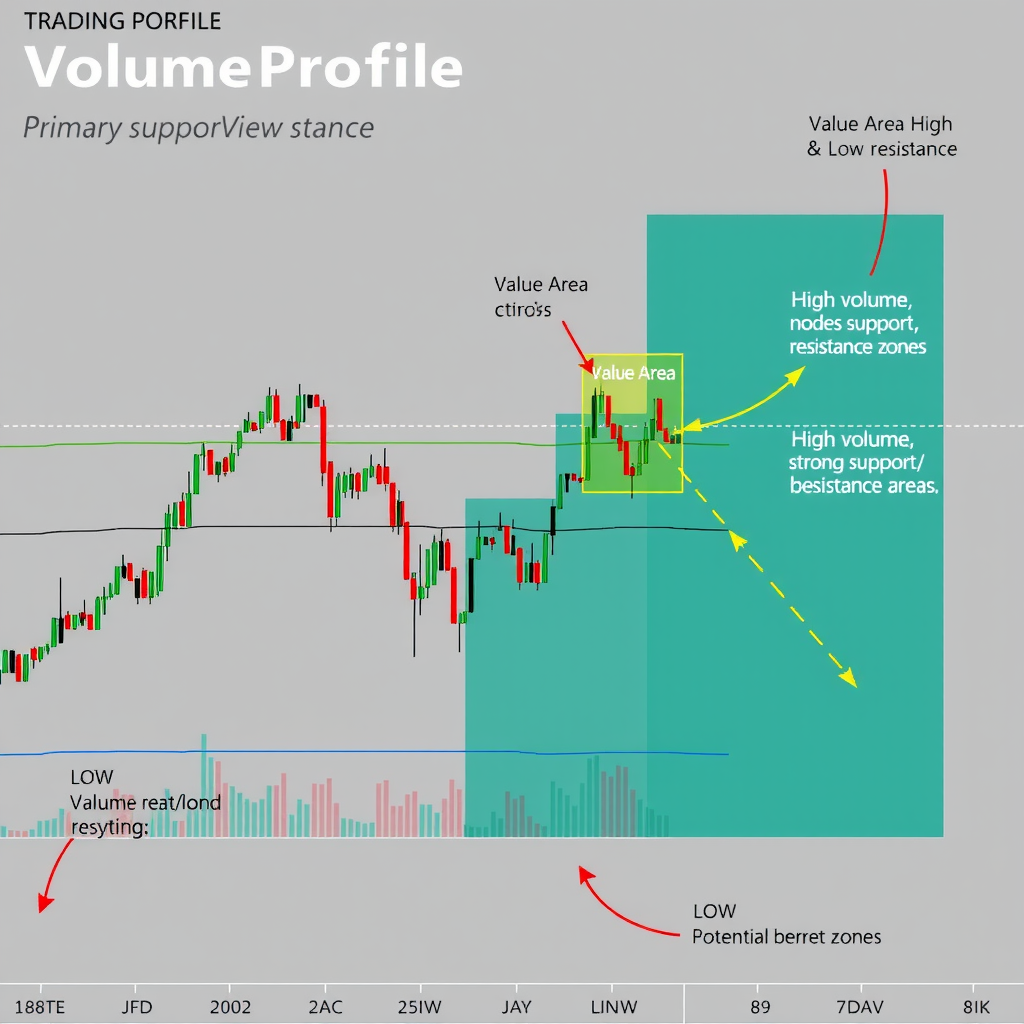
Value Area Interpretation
The Value Area (typically 70% of volume) defines the price range where most trading occurred. Key concepts:
- Value Area High (VAH):Upper boundary - acts as resistance when price is below, support when above
- Value Area Low (VAL):Lower boundary - acts as support when price is above, resistance when below
- Inside Value Area:Price within VA suggests balanced, range-bound conditions
- Outside Value Area:Price beyond VA indicates trending conditions or imbalance
Trading Strategy:When price opens outside the previous day's Value Area, it often continues in that direction. Look for continuation trades in the direction of the breakout.
High Volume Nodes (HVN)
High Volume Nodes are price levels with significantly elevated trading activity. They represent areas where:
- Strong support or resistance is likely to form
- Many traders have positions and vested interests
- Price may consolidate or reverse
- Stop losses are often clustered
Low Volume Nodes (LVN)
Low Volume Nodes show price levels with minimal trading activity. These areas are characterized by:
- Rapid price movement through the zone
- Lack of support or resistance
- Potential for quick breakouts or breakdowns
- Areas where traders found little value
Important Note:LVNs often act as price magnets. When price approaches an LVN from either direction, it tends to move quickly through it to reach the next HVN.
Advanced Volume Profile Techniques
Combining Multiple Timeframes
For comprehensive analysis, use Volume Profile across multiple timeframes:
- Weekly Volume Profile:Identify major support/resistance zones for swing trading
- Daily Volume Profile:Find intraday key levels and session-based patterns
- 4-Hour Volume Profile:Bridge the gap between daily and intraday analysis
- Hourly Volume Profile:Precise entry and exit points for day trading
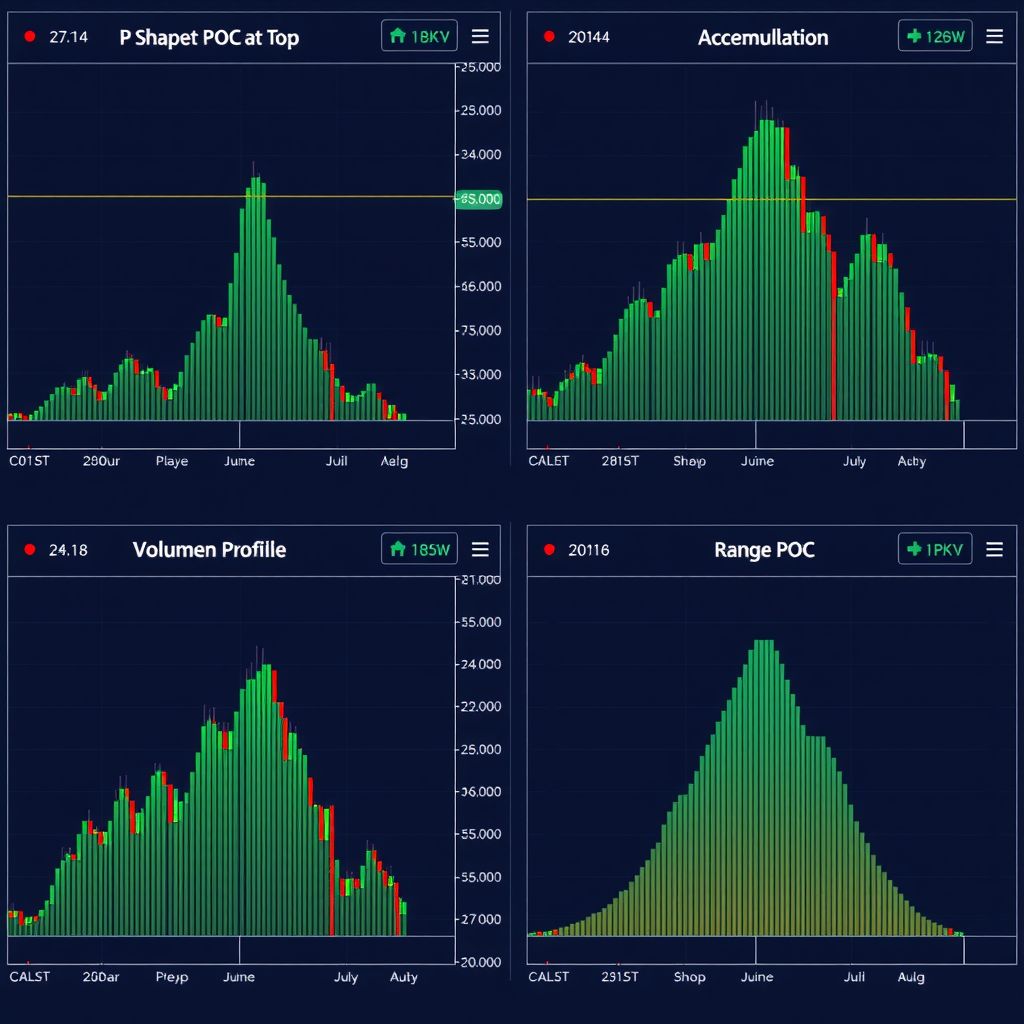
Volume Profile Patterns
P-Shaped Profile
POC and Value Area at the top of the range. Indicates distribution and potential bearish reversal. Sellers are in control.
b-Shaped Profile
POC and Value Area at the bottom of the range. Indicates accumulation and potential bullish reversal. Buyers are in control.
D-Shaped Profile
POC at one extreme with volume tapering off. Indicates strong directional movement and trending conditions.
Balanced Profile
POC in the middle with symmetrical distribution. Indicates range-bound, balanced market conditions.
Integrating with Other Indicators
Volume Profile works exceptionally well when combined with other technical analysis tools:
- Moving Averages:Confirm trend direction when price interacts with Volume Profile levels
- RSI/Stochastic:Identify overbought/oversold conditions at key Volume Profile zones
- MACD:Confirm momentum when price breaks through HVNs or LVNs
- Fibonacci Retracements:Look for confluence between Fib levels and Volume Profile zones
- Support/Resistance Lines:Validate traditional S/R with volume-based evidence
Common Mistakes to Avoid
Over-Reliance on Volume Profile Alone
Volume Profile is a powerful tool, but it should never be used in isolation. Always confirm signals with price action, trend analysis, and other technical indicators before making trading decisions.
Using Too Many Rows
Setting row count too high creates excessive noise and makes it difficult to identify significant volume levels. Stick to 24-32 rows for most applications and adjust based on your specific needs.
Ignoring Market Context
Volume Profile levels from low-liquidity periods or unusual market conditions may not be reliable. Always consider the broader market context, news events, and overall market structure.
Not Adjusting for Different Assets
Different markets and assets require different Volume Profile settings. Forex, stocks, and cryptocurrencies all have unique volume characteristics. Customize your settings for each asset class.
Forgetting to Update Fixed Range Profiles
Fixed Range Volume Profiles don't update automatically. Remember to create new profiles periodically to reflect current market conditions and recent price action.
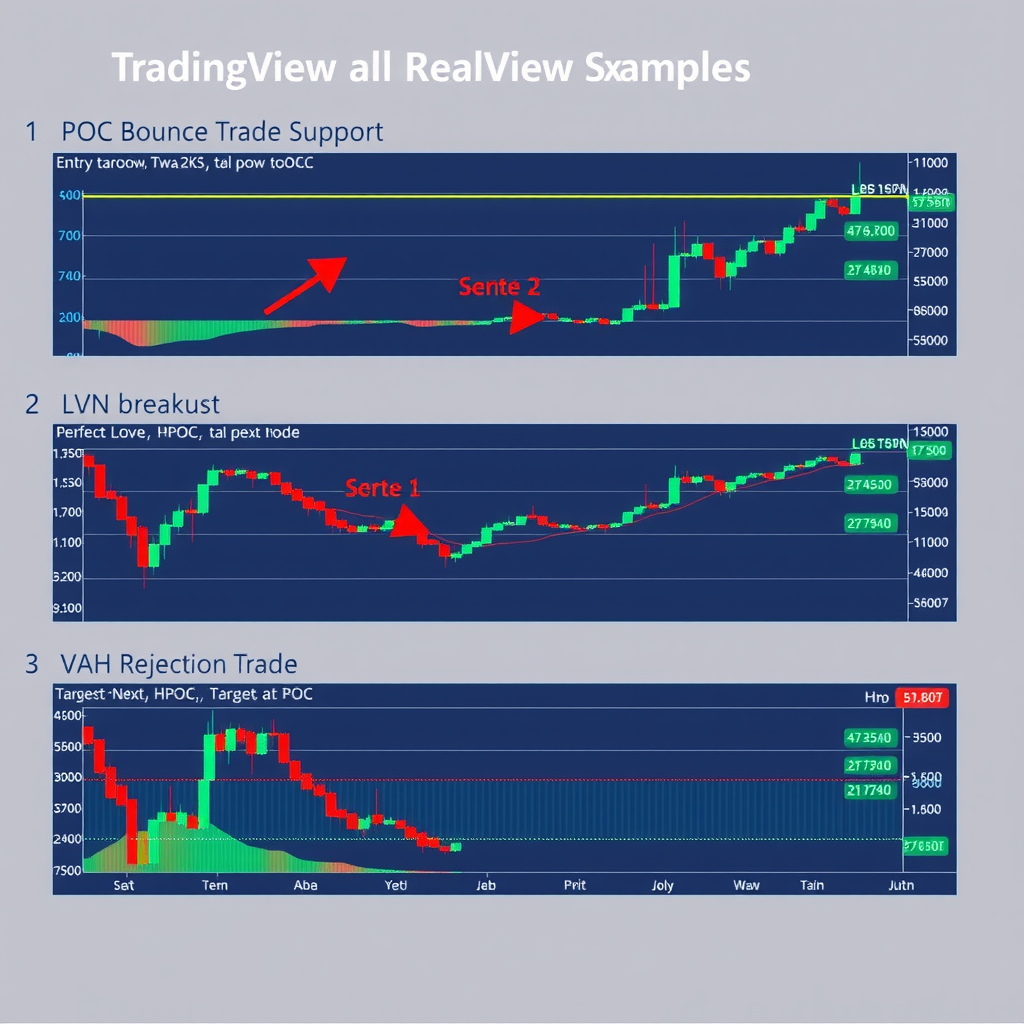
Practical Trading Examples
Example 1: POC Bounce Trade
Setup:Price is in an uptrend and pulls back to the previous day's POC level.
Entry:When price shows bullish confirmation (bullish candlestick pattern, RSI divergence) at the POC level.
Stop Loss:Below the Value Area Low or below the POC with a buffer.
Target:Previous high or next significant resistance level identified by Volume Profile.
Example 2: LVN Breakout Trade
Setup:Price consolidates near a Low Volume Node after a period of accumulation.
Entry:When price breaks through the LVN with strong volume and momentum.
Stop Loss:Back inside the consolidation zone or below the breakout candle.
Target:Next High Volume Node or significant resistance level.
Example 3: Value Area Rejection Trade
Setup:Price opens above the Value Area High in a downtrend and gets rejected.
Entry:Short position when price fails to hold above VAH and shows bearish confirmation.
Stop Loss:Above the VAH or above the rejection candle high.
Target:POC level or Value Area Low.
Conclusion and Next Steps
Volume Profile is an invaluable tool for understanding market structure and identifying high-probability trading opportunities. By following this walkthrough, you now have the knowledge to:
- Add and configure Volume Profile indicators on TradingView
- Understand the significance of POC, Value Area, HVNs, and LVNs
- Interpret different Volume Profile patterns and shapes
- Apply Volume Profile analysis to real trading scenarios
- Combine Volume Profile with other technical indicators for confirmation
Practice Recommendations
- Start by adding Session Volume Profile to your main trading charts
- Spend time observing how price interacts with POC and Value Area levels
- Create Fixed Range profiles for significant market events and analyze the results
- Backtest Volume Profile strategies on historical data before live trading
- Keep a trading journal documenting Volume Profile setups and outcomes
- Gradually integrate Volume Profile with your existing trading methodology
Remember that mastering Volume Profile takes time and practice. Start with the basics, observe price behavior at key levels, and gradually incorporate more advanced techniques as you gain confidence. The insights provided by volume distribution can significantly enhance your market understanding and trading decisions.
Continue exploring our other guides on TradingView chart setup and indicator configuration to further optimize your trading platform and analytical capabilities.
This guide was published on December 3, 2024. Volume Profile features and TradingView interface may be updated over time. Always refer to the latest TradingView documentation for the most current information.