Cookie Preferences

We use cookies to enhance your browsing experience, analyze site traffic, and personalize content. By clicking "Accept All", you consent to our use of cookies. You can manage your preferences or decline non-essential cookies by clicking "Decline".

TradingView Chart Setup Guides & Trading Platform Tutorials

Discover comprehensive guides on configuring TradingView charts, setting up technical indicators, creating custom templates, and optimizing your trading platform workflow. Learn how to configure chart layouts, connect alerts, and master advanced charting techniques for effective market analysis.

Chart Configuration Indicator Setup Trading Strategies Platform Tutorials Alert Configuration
TradingView workspace showing multiple chart panels with different timeframes - 1-hour, 4-hour, daily, and weekly charts synchronized and arranged in a grid layout with candlestick patterns and volume indicators visible on dark theme interface
SETUP GUIDE
NOVEMBER 15, 2024

How to Set Up Multiple Timeframe Analysis on TradingView

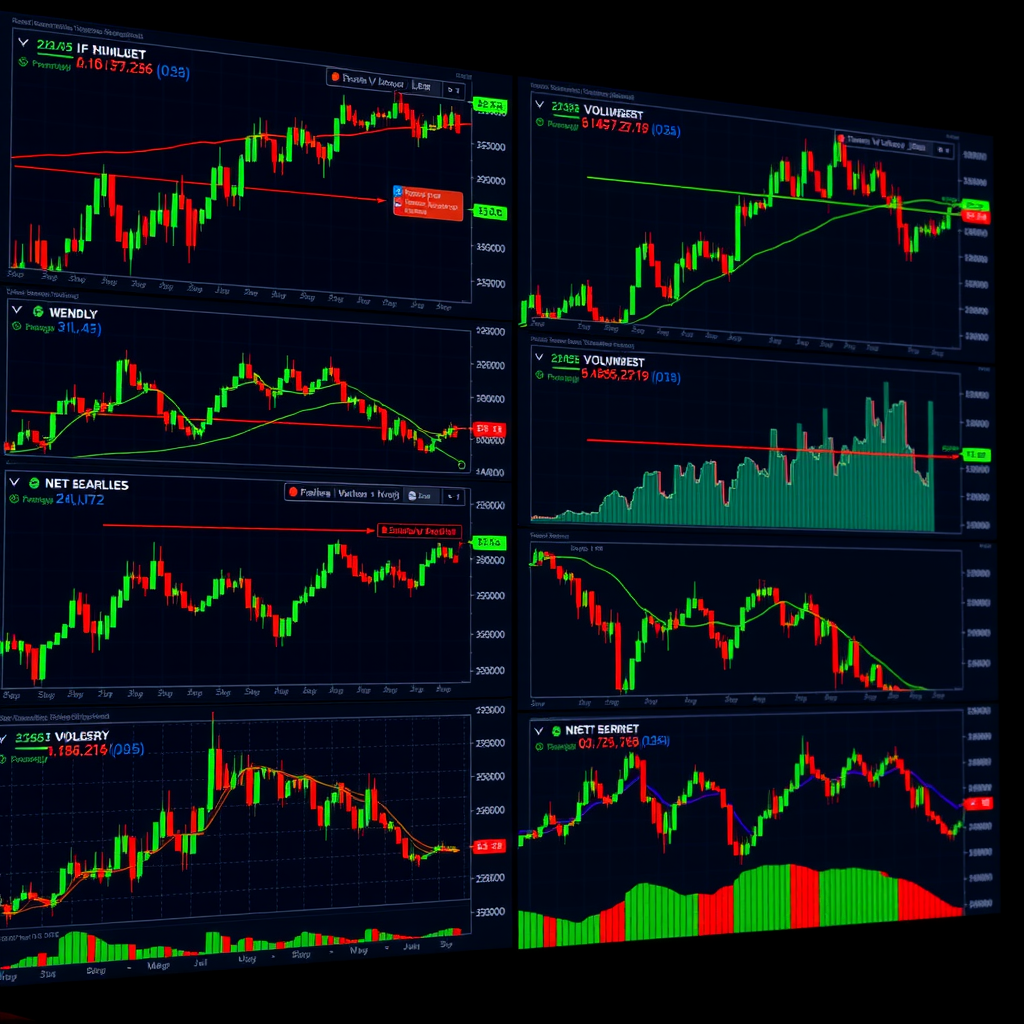
A comprehensive guide on configuring multiple timeframe charts simultaneously on TradingView. Learn how to arrange your workspace with different timeframes, synchronize chart movements, and use the multi-chart layout feature to analyze price action across various periods.

Read Full Guide →
Close-up view of RSI indicator settings panel on TradingView showing parameter configuration options including period length set to 14, overbought level at 70, oversold level at 30, with the RSI oscillator displayed below a price chart showing purple line oscillating between levels
INDICATOR
OCTOBER 28, 2024

Complete Guide to Configuring RSI Indicator with Custom Parameters

Step-by-step tutorial on setting up the Relative Strength Index (RSI) indicator with personalized settings. Discover how to adjust period lengths, overbought and oversold levels, add moving averages to RSI, and customize visual appearance for better technical analysis.

Read Full Guide →
Trading chart displaying Volume Profile indicator with horizontal histogram bars showing volume distribution at different price levels, highlighting high volume nodes and value areas in teal and green colors against a dark background with price action candlesticks
ADVANCED
DECEMBER 3, 2024

Setting Up Volume Profile Indicators: A Practical Walkthrough

Detailed instructions for adding and configuring Volume Profile indicators on your trading charts. This guide covers session volume profiles, fixed range profiles, parameter adjustments, and interpretation techniques to identify key support and resistance zones.

Read Full Guide →
TradingView alert creation dialog box showing moving average crossover condition setup with two exponential moving averages (EMA 9 and EMA 21) crossing on a chart, notification settings panel visible with options for email, SMS, and push notifications
AUTOMATION
SEPTEMBER 22, 2024

Creating Custom Alert Conditions for Moving Average Crossovers

Learn how to establish automated alerts for moving average crossover strategies on TradingView. This tutorial explains the process of setting up notification triggers, customizing alert messages, choosing delivery methods, and managing multiple alert conditions efficiently.

Read Full Guide →
Trading chart template featuring multiple Fibonacci retracement levels drawn from swing high to swing low showing golden ratio levels at 23.6%, 38.2%, 50%, 61.8%, and 78.6% with Fibonacci extension tool also visible, all displayed on a professional dark-themed chart interface
TEMPLATES
NOVEMBER 8, 2024

Building a Custom Chart Template with Fibonacci Tools

A practical guide to creating reusable chart templates that include Fibonacci retracement and extension tools. Explore how to save drawing tool configurations, set default parameters, apply templates across different instruments, and organize your workspace for consistent technical analysis.

Read Full Guide →