Complete Guide to Configuring RSI Indicator with Custom Parameters
The Relative Strength Index (RSI) is one of the most popular momentum oscillators in technical analysis. This comprehensive guide will walk you through every aspect of configuring RSI with custom parameters to match your trading strategy and preferences.
Understanding RSI Basics
Before diving into configuration, it's essential to understand what RSI measures. The RSI is a momentum oscillator that measures the speed and magnitude of price movements on a scale from 0 to 100. Developed by J. Welles Wilder Jr., it helps traders identify overbought and oversold conditions in the market.
Traditional RSI interpretation uses two key levels: readings above 70 indicate overbought conditions, while readings below 30 suggest oversold conditions. However, these levels can be customized based on your trading style and market conditions.
Step 1: Adding RSI to Your Chart
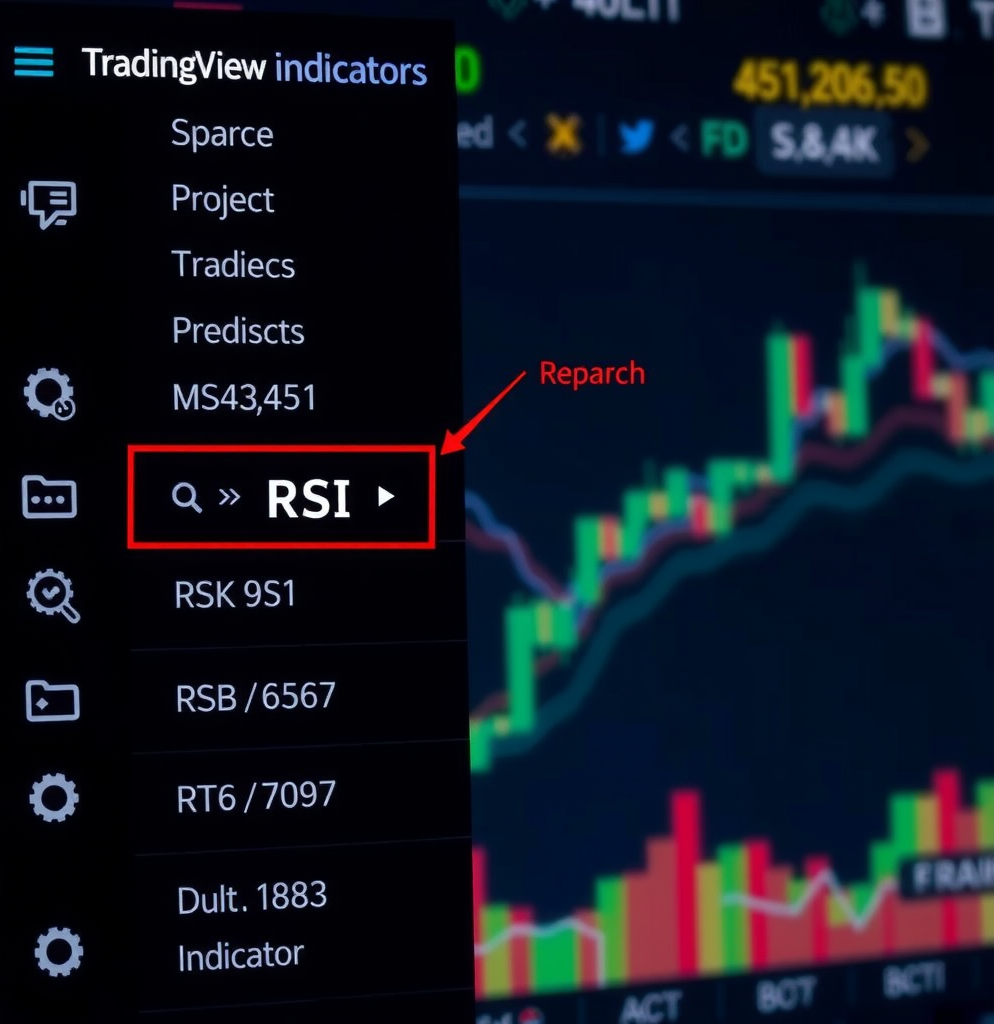
To begin configuring your RSI indicator, first add it to your TradingView chart:
- Open your TradingView chart and click on theIndicatorsbutton at the top of the screen
- In the search box, type "RSI" or "Relative Strength Index"
- Select Relative Strength Indexfrom the built-in indicators list
- The RSI will appear in a separate panel below your main price chart
Step 2: Accessing RSI Settings
Once the RSI is added to your chart, you can access its configuration settings:
- Hover over the RSI indicator name in the indicator panel
- Click on the gear icon(settings) that appears
- The settings dialog will open with multiple tabs: Inputs, Style, and Visibility
Pro Tip:You can also right-click directly on the RSI line in the indicator panel and select "Settings" from the context menu for quick access.
Step 3: Configuring RSI Period Length
The period length is the most fundamental parameter of the RSI indicator. It determines how many periods (candles) are used to calculate the RSI value.
Default Period Setting
The standard RSI period is14, which was recommended by J. Welles Wilder in his original work. This setting works well for most timeframes and trading styles, providing a balanced view of momentum.
Adjusting the Period
In the Inputstab of the RSI settings, you'll find the "Length" parameter:
- Shorter periods (5-9):Create a more sensitive RSI that responds quickly to price changes. Ideal for day trading and scalping strategies, but generates more false signals.
- Standard period (14):Provides balanced sensitivity and reliability. Suitable for swing trading and general technical analysis.
- Longer periods (21-28):Produce a smoother RSI line with fewer signals. Better for position trading and reducing noise in volatile markets.
Step 4: Customizing Overbought and Oversold Levels
The overbought and oversold levels are horizontal reference lines that help identify extreme conditions in the market.
Standard Levels
By default, TradingView sets these levels at:
- Overbought: 70- Indicates potential selling pressure
- Oversold: 30- Suggests potential buying opportunity
Adjusting Levels for Different Markets
Navigate to theStyletab in RSI settings to modify these levels:
- Trending markets (80/20):Use more extreme levels to avoid premature signals during strong trends
- Range-bound markets (70/30):Standard levels work well for sideways price action
- Volatile markets (75/25):Slightly adjusted levels help filter out noise
- Conservative approach (60/40):Tighter levels for more frequent signals, though with higher false positive rate
Important:Remember that overbought doesn't necessarily mean "sell" and oversold doesn't always mean "buy." These levels indicate potential reversal zones but should be confirmed with other technical analysis tools.
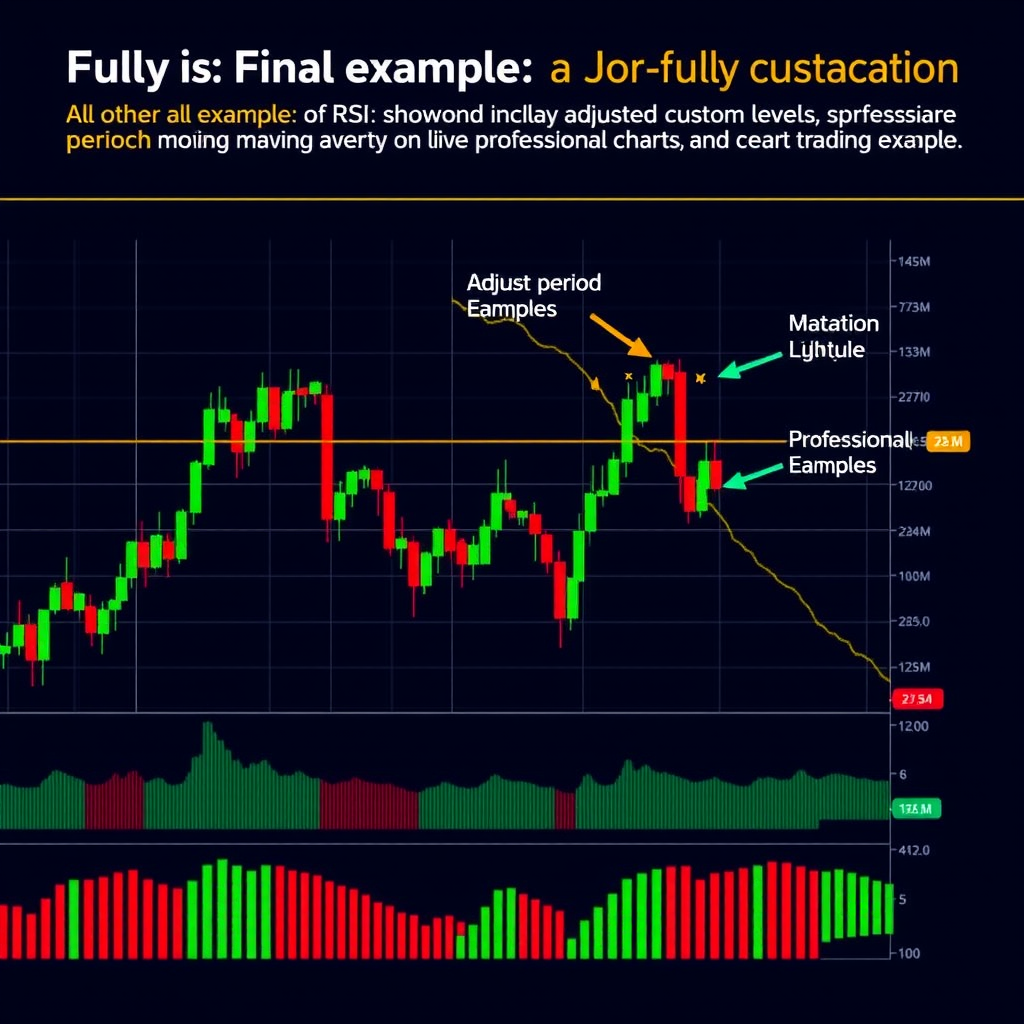
Step 5: Adding Moving Averages to RSI
One powerful customization is adding a moving average to your RSI line. This helps smooth out the indicator and identify trend direction within the RSI itself.
Enabling RSI Moving Average
- In the RSI settings, go to theInputs tab
- Look for the "RSI-based MA" or "MA Length" parameter
- Enter your desired moving average period (common values: 9, 14, or 21)
- Switch to the Styletab and enable the "RSI-based MA" line
- Customize the color and line style for easy visual distinction
Trading with RSI Moving Average
The RSI moving average creates additional trading signals:
- Bullish crossover:RSI crosses above its moving average, suggesting upward momentum
- Bearish crossover:RSI crosses below its moving average, indicating downward momentum
- Trend confirmation:RSI staying above/below its MA confirms the prevailing trend
Step 6: Customizing Visual Appearance
Personalizing the visual style of your RSI makes it easier to read and interpret at a glance.
RSI Line Customization
In the Styletab, you can modify:
- Line color:Choose a color that contrasts well with your chart background
- Line thickness:Adjust from 1-4 pixels based on your preference
- Line style:Select solid, dashed, or dotted lines
- Transparency:Set opacity level for subtle or prominent display
Background and Band Styling
Enhance readability by customizing the background:
- Overbought band:Add a colored background above 70 (e.g., light red with transparency)
- Oversold band:Add a colored background below 30 (e.g., light green with transparency)
- Middle line (50):Enable and style the centerline for neutral momentum reference
- Level lines:Customize the appearance of 30 and 70 level lines (color, thickness, style)
Step 7: Advanced RSI Configurations
Source Data Selection
In the Inputstab, you can change the source data used for RSI calculation:
- Close (default):Uses closing prices, most common setting
- Open:Based on opening prices, useful for gap analysis
- High:Uses highest prices, emphasizes bullish momentum
- Low:Based on lowest prices, highlights bearish pressure
- HL2:Average of high and low, smooths out extremes
- HLC3:Average of high, low, and close, provides balanced view
- OHLC4:Average of all four prices, most comprehensive smoothing
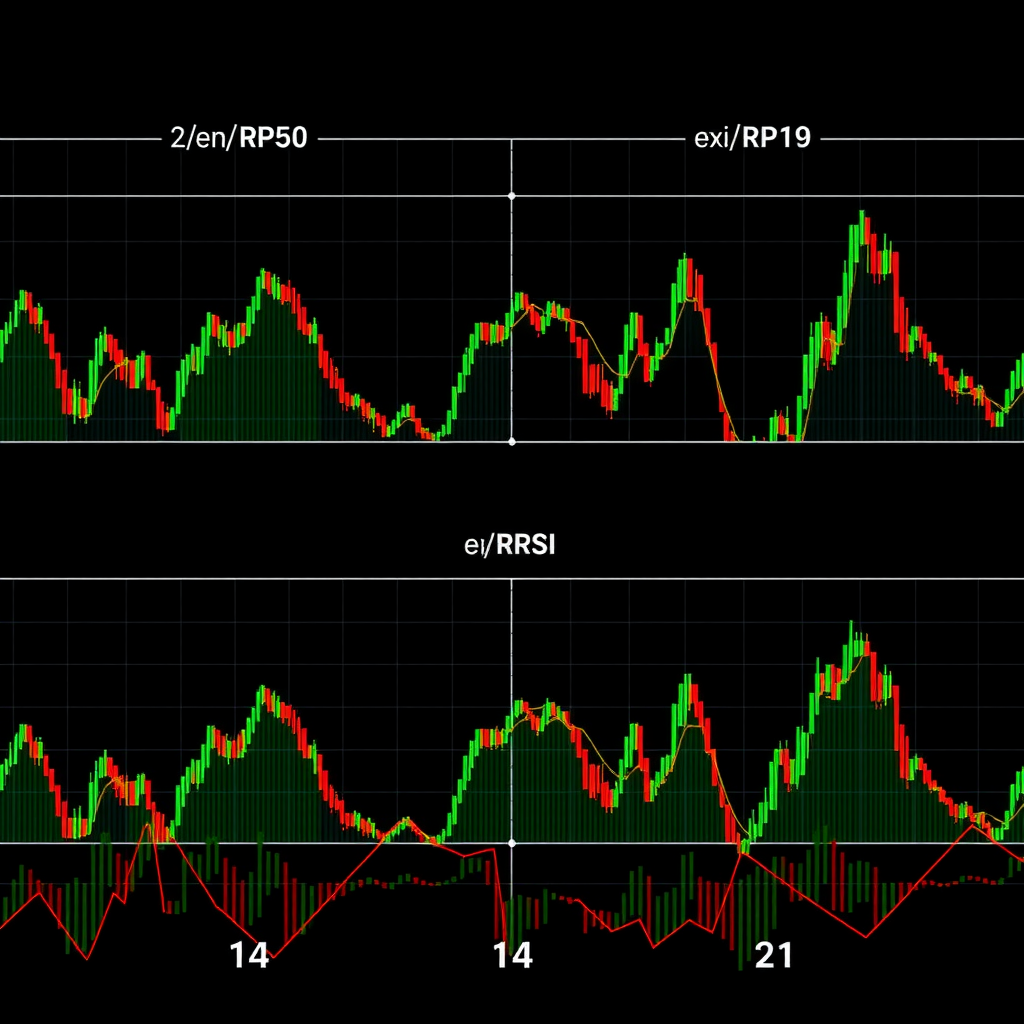
Multiple RSI Timeframes
For advanced analysis, consider adding multiple RSI indicators with different settings:
- Add a second RSI with a shorter period (e.g., 9) for short-term signals
- Keep the standard 14-period RSI for medium-term analysis
- Add a third RSI with longer period (e.g., 21) for trend confirmation
- Use different colors for each RSI to distinguish them easily
Advanced Technique:When multiple RSI lines align in the same direction, it provides stronger confirmation of momentum. Look for convergence of short, medium, and long-term RSI readings.
Step 8: Saving Your Custom RSI Configuration
Once you've configured your RSI to your preferences, save it for future use:
- Click on the indicator name in the indicator panel
- Select "Add to favorites"from the dropdown menu
- Your custom RSI will now appear in your favorites list for quick access
- Alternatively, save your entire chart layout with the configured RSI using the "Save" button
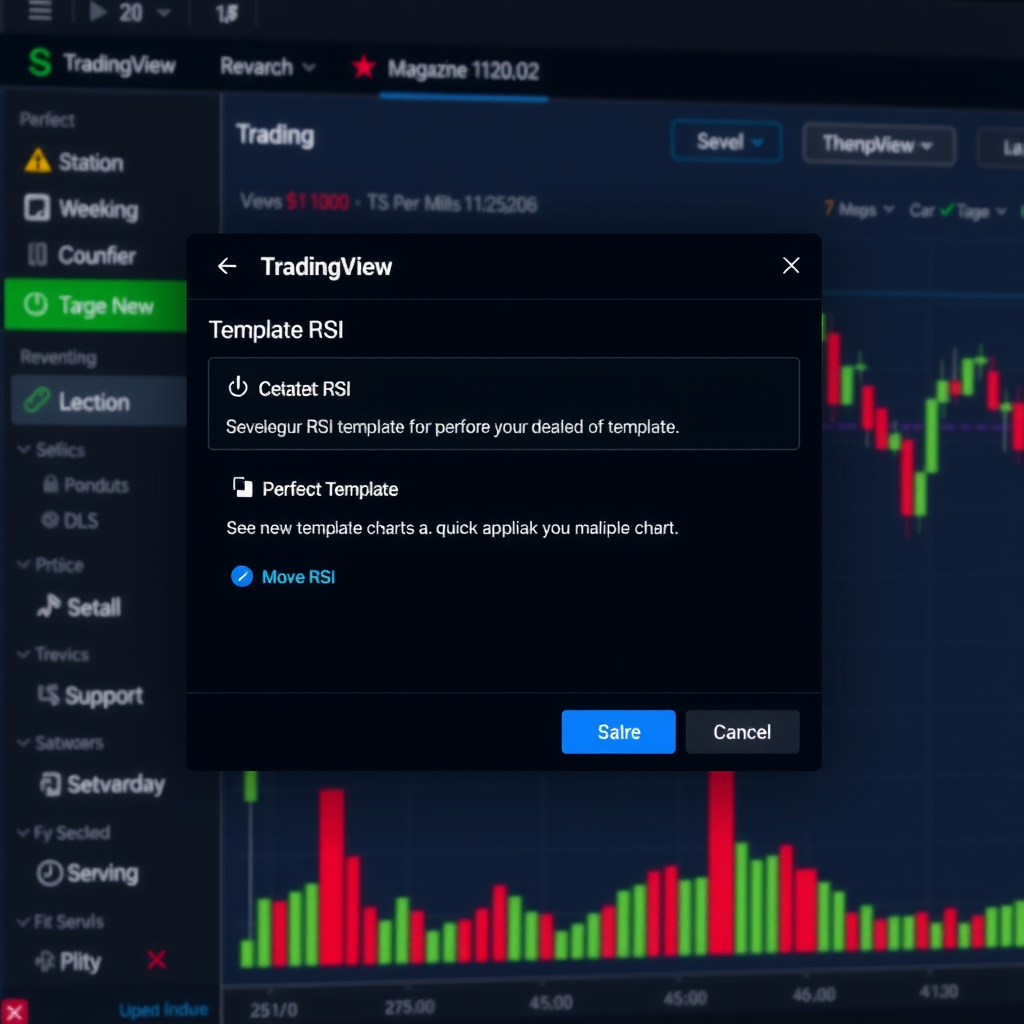
Creating Templates
For even faster setup across multiple charts:
- Configure your RSI and other indicators as desired
- Click the Templatesbutton at the top of the chart
- Select "Save indicator template"
- Give your template a descriptive name (e.g., "RSI 14 with MA 9")
- Apply this template to any chart with one click
Common RSI Configuration Strategies
Day Trading Setup
- Period: 9 or 14
- Levels: 70/30 or 75/25
- MA:9-period moving average
- Timeframe:5-minute to 1-hour charts
Swing Trading Setup
- Period: 14 (standard)
- Levels: 70/30
- MA:14 or 21-period moving average
- Timeframe:4-hour to daily charts
Position Trading Setup
- Period: 21 or 28
- Levels: 80/20
- MA:21-period moving average
- Timeframe:Daily to weekly charts
Troubleshooting Common Issues
RSI Too Sensitive
If your RSI generates too many signals:
- Increase the period length (try 21 or 28)
- Widen the overbought/oversold levels (use 80/20)
- Add a moving average for confirmation
- Switch to a higher timeframe
RSI Too Slow
If your RSI misses important moves:
- Decrease the period length (try 9 or 7)
- Tighten the overbought/oversold levels (use 60/40)
- Remove or shorten the moving average
- Consider using a lower timeframe
RSI Not Visible
If you can't see your RSI properly:
- Check the Visibilitytab to ensure it's enabled for your timeframe
- Adjust the line color for better contrast with your chart theme
- Increase line thickness in the Style tab
- Resize the indicator panel by dragging its border
Success Tip:The best RSI configuration is one that matches your trading style and the specific market you're analyzing. Don't be afraid to experiment with different settings and keep notes on what works best for different conditions.
Conclusion
Configuring the RSI indicator with custom parameters allows you to tailor this powerful momentum tool to your specific trading needs. By adjusting the period length, overbought and oversold levels, adding moving averages, and customizing the visual appearance, you can create an RSI setup that provides clear, actionable signals for your trading strategy.
Remember that no single configuration works perfectly for all markets and timeframes. The key is to understand how each parameter affects the indicator's behavior and to test different settings with your trading approach. Start with the standard 14-period RSI and 70/30 levels, then make incremental adjustments based on your observations and results.
As you gain experience with RSI configuration, you'll develop an intuitive sense of which settings work best for different market conditions. Keep experimenting, document your findings, and continuously refine your approach to maximize the effectiveness of this versatile technical indicator.