How to Set Up Multiple Timeframe Analysis on TradingView
Multiple timeframe analysis is a powerful technique that allows traders to gain a comprehensive view of market trends by examining price action across different time periods simultaneously. TradingView offers robust tools to configure and synchronize multiple charts, making this analysis method accessible and efficient.
Understanding Multiple Timeframe Analysis
Multiple timeframe analysis involves examining the same trading instrument across various time periods to identify trends, support and resistance levels, and potential entry and exit points. This approach helps traders avoid false signals and make more informed decisions by understanding both the bigger picture and short-term price movements.
The typical approach uses three timeframes: a higher timeframe for overall trend direction, a medium timeframe for trade setup identification, and a lower timeframe for precise entry timing. TradingView's multi-chart layout feature makes implementing this strategy straightforward and visually intuitive.
Accessing the Multi-Chart Layout
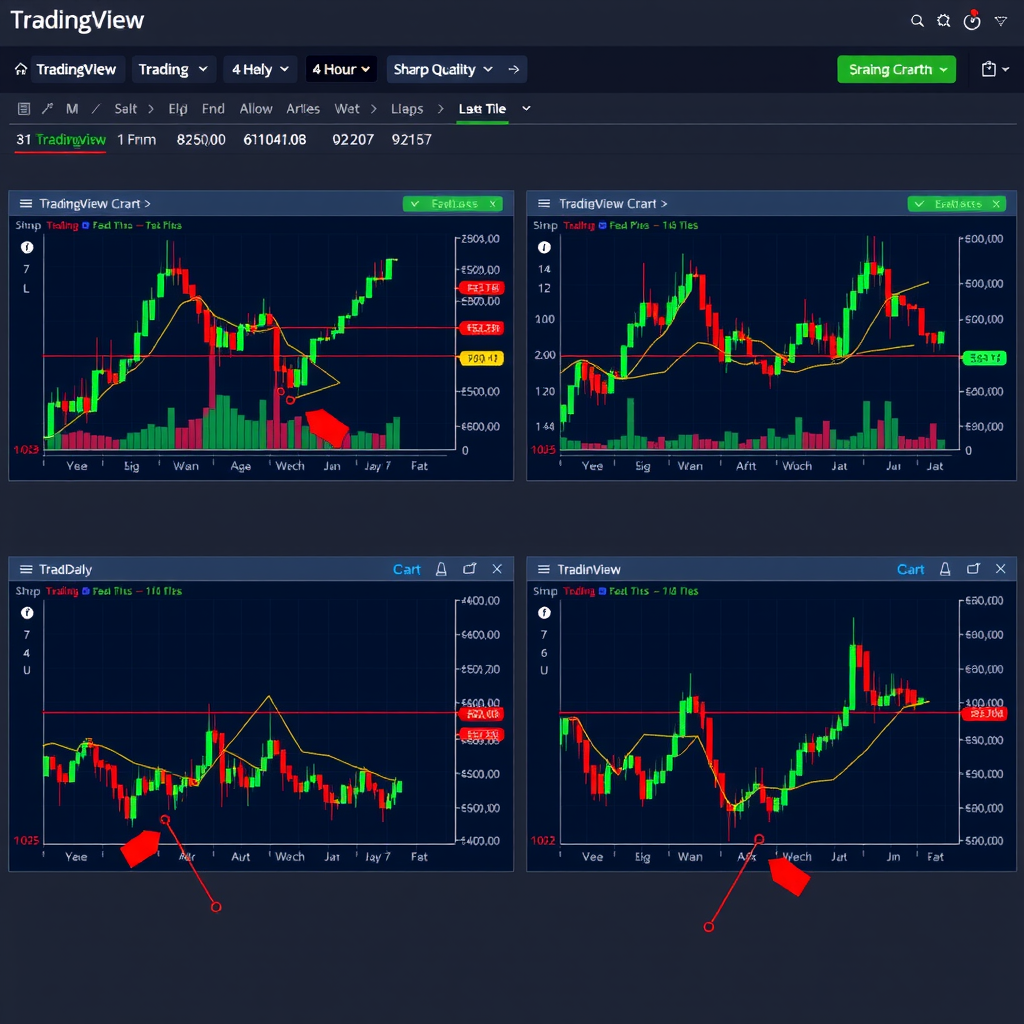
To begin setting up multiple timeframe analysis on TradingView, you'll need to access the multi-chart layout feature. This powerful tool allows you to view up to eight charts simultaneously on a single screen.
Pro Tip:The multi-chart layout feature is available on all TradingView subscription tiers, including the free plan, though the number of indicators per chart may vary based on your subscription level.
- Open TradingView and navigate to your main chart view
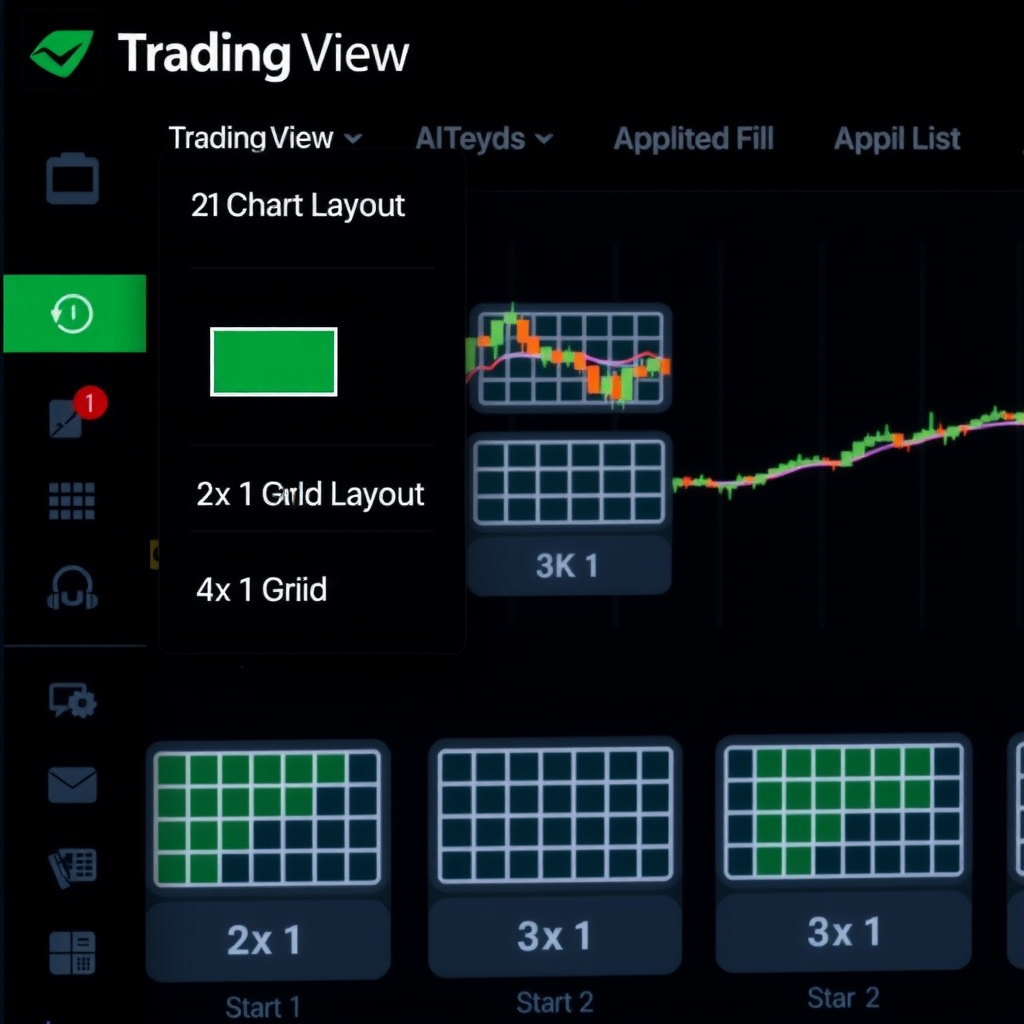
- Look for the layout icon in the top toolbar (it resembles a grid of squares)
- Click the layout icon to reveal various multi-chart configuration options
- Select your preferred layout: 2x1, 2x2, 3x1, 4x1, or custom arrangements
Configuring Individual Chart Timeframes
Once you've selected your multi-chart layout, the next step is to configure each chart with different timeframes. This process is straightforward and allows for quick adjustments as your analysis needs change.
Setting Up Your First Chart
Start with your highest timeframe chart, which will provide the overall market context:
- Click on the first chart panel to make it active
- Enter your desired trading instrument in the symbol search box
- Select the timeframe from the timeframe selector (e.g., Daily or Weekly for long-term trend)
- Add your preferred indicators and drawing tools
Configuring Additional Timeframes
Repeat the process for each additional chart panel, progressively decreasing the timeframe:
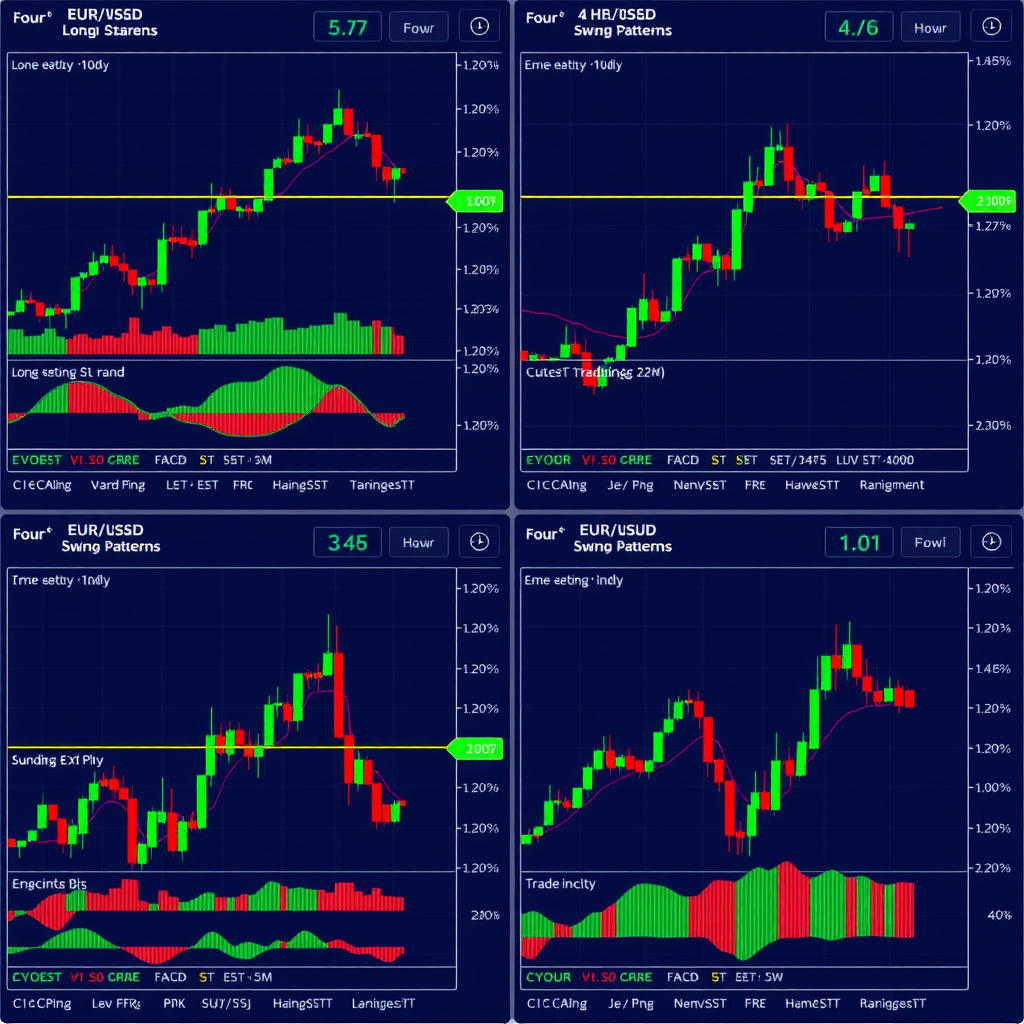
- Chart 2:Medium timeframe (4-hour or 1-hour) for identifying trade setups
- Chart 3:Lower timeframe (15-minute or 5-minute) for entry timing
- Chart 4:Optional additional timeframe or alternative view
Synchronizing Chart Movements
One of the most powerful features of TradingView's multi-chart layout is the ability to synchronize chart movements. This ensures that when you zoom, pan, or move the crosshair on one chart, all other charts respond accordingly, maintaining alignment across timeframes.
Enabling Chart Synchronization
- Right-click on any chart panel in your multi-chart layout
- Select "Sync charts" from the context menu
- Choose "Symbol and interval" to sync both the trading instrument and time alignment
- Alternatively, select "Symbol only" if you want different timeframes of the same instrument
Best Practice:Use "Symbol only" synchronization for multiple timeframe analysis. This keeps all charts focused on the same instrument while allowing each to maintain its unique timeframe perspective.
Crosshair Synchronization
The crosshair synchronization feature is particularly valuable for multiple timeframe analysis. When enabled, moving your cursor over one chart will display the corresponding time and price levels on all synchronized charts, making it easy to identify how a specific moment appears across different timeframes.
To maximize the effectiveness of crosshair synchronization, ensure all your charts are properly aligned and that you're using consistent indicator settings across timeframes where applicable.
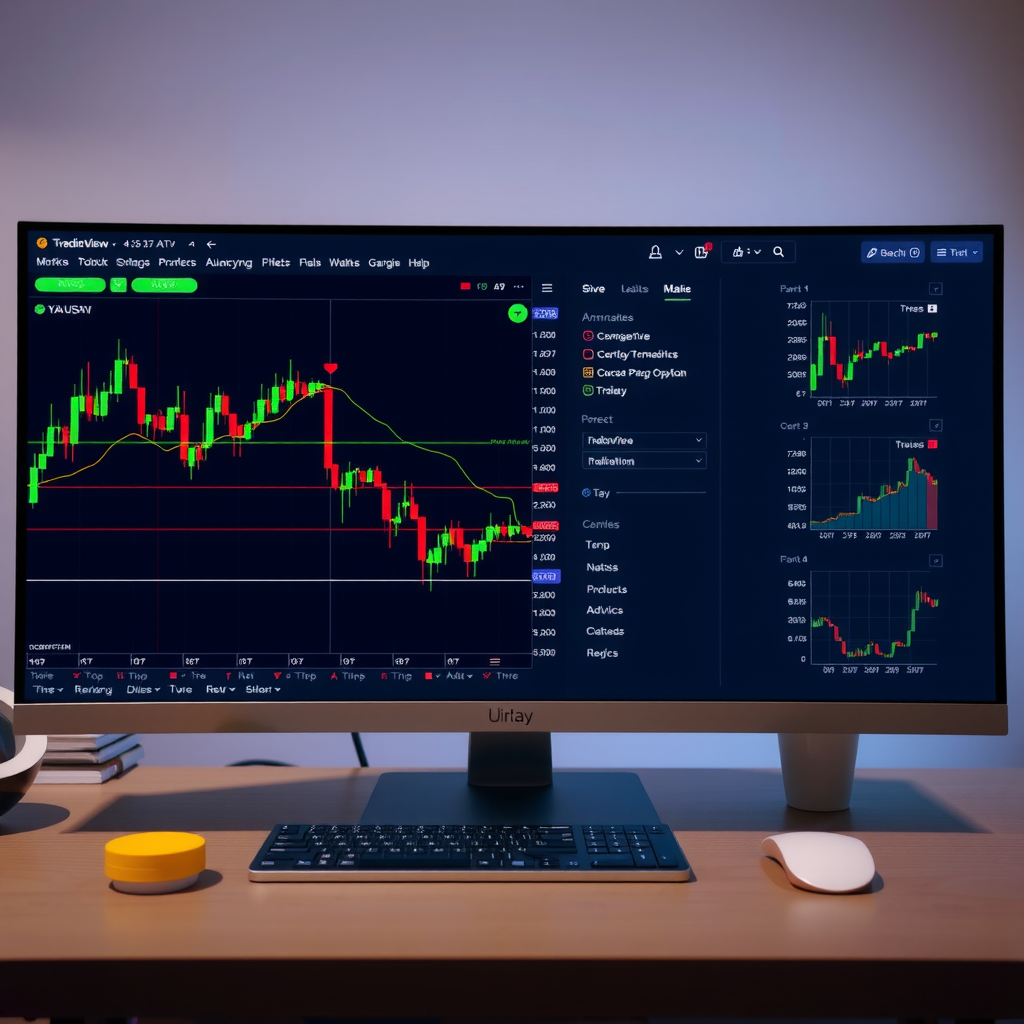
Optimizing Your Workspace Layout
Creating an efficient workspace layout is crucial for effective multiple timeframe analysis. TradingView offers several customization options to help you optimize your viewing experience.
Adjusting Chart Panel Sizes
You can resize individual chart panels by clicking and dragging the dividers between them. This flexibility allows you to:
- Allocate more screen space to your primary analysis timeframe
- Create a larger panel for detailed technical analysis
- Maintain smaller panels for quick reference timeframes
- Adapt your layout based on current market conditions and analysis needs
Saving Your Layout Configuration
Once you've perfected your multiple timeframe setup, save it as a custom layout to access it quickly in future trading sessions:
- Click the layout icon in the top toolbar
- Select "Save layout" from the dropdown menu
- Give your layout a descriptive name (e.g., "Multi-Timeframe Forex" or "Stock Day Trading Setup")
- Access your saved layouts anytime from the layout menu
Adding Indicators Across Multiple Timeframes
Applying consistent indicators across your multiple timeframe charts helps maintain analytical coherence and makes pattern recognition easier. However, it's important to understand how indicators behave differently on various timeframes.
Recommended Indicator Setup
For effective multiple timeframe analysis, consider using these indicators consistently across your charts:
- Moving Averages:Use the same periods (e.g., 20, 50, 200) across all timeframes to identify trend alignment
- RSI (Relative Strength Index):Helps identify overbought/oversold conditions across different time horizons
- Volume Profile:Reveals significant price levels and areas of interest on each timeframe
- Support and Resistance Levels:Draw key levels on higher timeframes and observe how they interact with price on lower timeframes
Important Note:Be mindful of indicator limits on your TradingView subscription. Free accounts are limited to 3 indicators per chart, while paid plans offer more. Plan your indicator usage accordingly across your multi-chart layout.
Practical Trading Workflow
Now that your multiple timeframe analysis setup is complete, here's a practical workflow for using it in your daily trading:
Step-by-Step Analysis Process
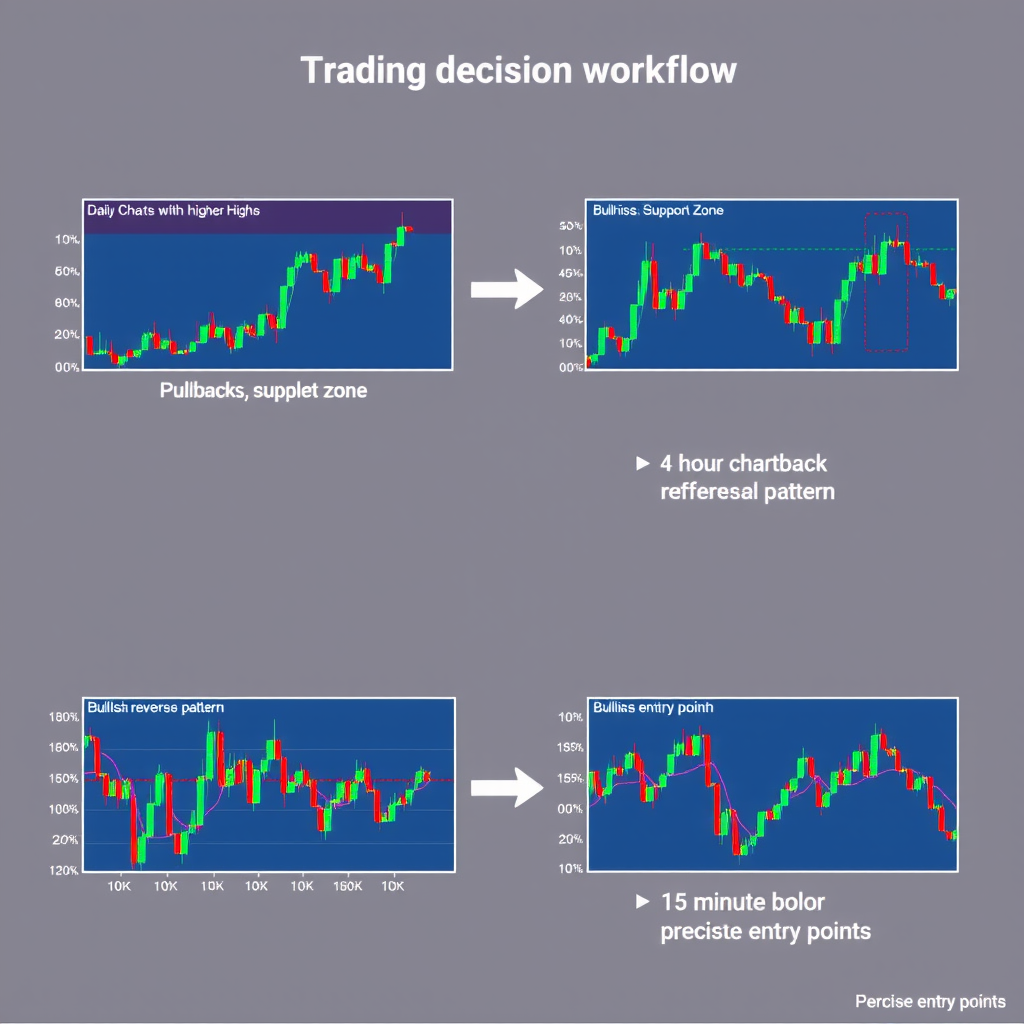
- Start with the highest timeframe:Identify the overall trend direction, major support and resistance levels, and the broader market context
- Move to the medium timeframe:Look for trade setup patterns that align with the higher timeframe trend, such as pullbacks, breakouts, or reversal patterns
- Refine with the lower timeframe:Use the shortest timeframe to identify precise entry points, stop-loss placement, and initial profit targets
- Confirm across all timeframes:Ensure your trade idea makes sense across all time horizons before executing
Advanced Tips and Tricks
Using Chart Templates
Create chart templates with your preferred indicators and settings, then apply them quickly to new charts in your multi-timeframe layout. This saves time and ensures consistency across your analysis.
Keyboard Shortcuts
Master these keyboard shortcuts to navigate your multi-chart layout efficiently:
- Tab:Cycle through chart panels
- Alt + 1, 2, 3, etc.:Switch between saved layouts
- Ctrl + Mouse Wheel:Zoom in/out on all synchronized charts
- Space + Drag:Pan across all synchronized charts simultaneously
Mobile and Tablet Considerations
While multiple timeframe analysis works best on desktop with a large screen, TradingView's mobile app allows you to switch between timeframes quickly. Consider using the desktop setup for detailed analysis and the mobile app for monitoring positions on the go.
Common Mistakes to Avoid
As you implement multiple timeframe analysis, be aware of these common pitfalls:
- Analysis paralysis:Don't overcomplicate your setup with too many timeframes or indicators
- Ignoring higher timeframes:Always respect the trend on higher timeframes, even when lower timeframes suggest otherwise
- Inconsistent indicator settings:Use the same indicator parameters across timeframes for meaningful comparison
- Forgetting to save layouts:Save your configurations to avoid rebuilding your setup each session
Conclusion
Setting up multiple timeframe analysis on TradingView is a straightforward process that can significantly enhance your trading decisions. By following this guide, you've learned how to configure multi-chart layouts, synchronize chart movements, apply indicators consistently, and create an efficient workspace for comprehensive market analysis.
Remember that the key to successful multiple timeframe analysis lies not just in the technical setup, but in developing a systematic approach to reading and interpreting information across different time horizons. Practice using your new setup with paper trading or backtesting before applying it to live trades.
As you become more comfortable with this approach, you'll find that multiple timeframe analysis becomes second nature, helping you identify high-probability trading opportunities while avoiding false signals that appear on single timeframes.
Quick Reference Summary
- Access multi-chart layout from the grid icon in the top toolbar
- Configure each chart with progressively lower timeframes
- Enable "Symbol only" synchronization for multiple timeframe analysis
- Apply consistent indicators across all timeframes
- Save your layout configuration for quick access
- Start analysis from highest to lowest timeframe